Why a £1,200/sqft Kensington Site Can Be Harder to Fund in 2026 Than a £650/sqft Outer London One
It looks like a contradiction. A site at £1,200 per square foot in Kensington and Chelsea clears the £650 per square foot London viability threshold almost twice over on price. A site at £700 per square foot in Walthamstow clears it by less than 10%. And yet in 2026, the Kensington site will price 50 to 100 basis points wider on senior debt and cap leverage 5 percentage points lower (60-65% LTGDV vs 65-70%). Mezzanine appetite on the Kensington site is materially thinner. JV equity demands 22-28% IRR on the Kensington stack versus 18-22% on the Walthamstow stack. Same lender pool. Opposite end of the market. Worse pricing on the more expensive site. This is not irrational. It is the trajectory question doing real work in the underwriting model.
This piece walks through why prime-central schemes are now harder to fund than connected-outer schemes despite clearing viability by a much larger margin, what the trajectory test actually looks like inside a credit committee model, and what the 17-percentage-point spread between K&C at -11.2% and Walthamstow at +5.9% means for capital allocation across London in 2026.
What -11.2% actually means at this end of the market
It is worth sitting with the headline before walking into the anatomy. Kensington and Chelsea average values still sit comfortably above £1,200 per square foot. A scheme here clears the £650 per square foot London viability line three times over on price alone. That is not the issue. The issue is what -11.2% does to the rest of the underwriting model.
A site acquired in 2021 at £1,400 per square foot residual, against a then-credible GDV of £2,000 per square foot, is now being valued against a GDV of £1,750 to £1,800 on like-for-like comparables. Build cost has gone the other way. RICS BCIS is up roughly 18% over the same window. The combined effect has compressed margin to the point where a scheme that penciled at a 22% margin on cost in 2021 is now closer to 12% to 14%, and that sits inside the band where senior lenders ask harder questions and require larger sponsor commitments.
The borough is not below viability. It is below the margin band that the equity stack was originally underwritten on. That is the operative distinction.
The anatomy: where in K&C the correction is sharpest
The borough does not move as a single market. The -11.2% is a borough-wide average that conceals a sharper sub-zone story.
Knightsbridge and Belgravia (SW1X / SW1W)
Down materially more than the borough average on a transaction-weighted basis. Super-prime above £20m has the thinnest demand depth of any segment of the London market. Trophy townhouse and lateral-flat repositioning is still active because the construction-to-exit window is short, but new-build resi-led at this scale is largely paused. Anything that does transact is sponsor-balance-sheet led with very thin senior debt appetite.
South Kensington and the Albertopolis quarter (SW7)
The most stable sub-zone within the correction. Values down but with credible buyer depth at the £4m to £8m end driven by a more diversified UK and European buyer base than the super-prime. Schemes between £15m and £40m GDV with strong product differentiation are still being structured here, but at meaningfully wider margins than 2021.
Chelsea proper, including King’s Road and the riverside (SW3 / SW10)
Closer to the borough average. The Chelsea waterfront and the King’s Road corridor have been more resilient than Knightsbridge, but new-build absorption has slowed and several 2024-2025 completions have shifted from open-market sale to BTR balance-sheet take-out at meaningful discounts.
Notting Hill and Holland Park (W11 / W14)
The most resilient sub-zone in K&C. Family townhouse stock, deeper end-user buyer base, less exposure to international super-prime swings. Reposition and large refurb plays clear here without the trajectory caution that sits across the rest of the borough.
The takeaway: when a lender sees “Kensington and Chelsea” on a term sheet they are no longer pricing one market. They are asking which sub-zone, what the absorption assumptions are, and what the sponsor exit looks like under a -5% to -10% scenario from current levels.
What is moving the number
Three forces compound to deliver the -11.2%.
The first is international buyer activity, which has remained structurally lower than the 2014 to 2019 baseline. Stamp duty reforms, non-dom regime changes, and a stronger sterling against several historical buyer currencies have all weighed on demand depth at the £3m-plus end where K&C volumes concentrate. This is not new in 2026. It is a five-year drift that has compounded into a thin-bid market at the top end.
The second is the supply of high-end stock arriving into that thinner market. Several large completions through 2024 and 2025 added inventory in a softer demand environment than developers underwrote when sites were acquired in 2018 to 2021. Some of that stock has cleared, much has not, and the discount required to clear the residual has dragged down the comparable set.
The third is the relative-rate pull. With outer-London transport-anchored boroughs delivering price growth (Walthamstow at +5.9%, Redbridge at +5.3%, Bromley at +3.0%), capital that historically anchored to prime central is finding yield and trajectory elsewhere in the city. That is not a rotation that finishes by H2 2026. It compounds.
How lenders are pricing K&C in 2026
Senior debt in the prime central correction zone is materially tighter than in connected outer London. A typical Chelsea or South Kensington scheme is pricing 50 to 100 basis points wider than the equivalent Walthamstow or Bromley scheme on senior debt, with LTGDV ratios capped 5 percentage points lower (60 to 65% in the correction zone vs 65 to 70% in connected outer). Stretched senior products are available only with strong sponsor balance sheets and demonstrable cost-plan certainty.
Mezzanine finance is the bigger structural shift. The 12% per annum that prices in connected outer is now 13%-plus in prime central, and with a materially smaller appetite pool. JV equity providers are demanding 22 to 28% IRR targets versus 18 to 22% in the outer growth zone. The IRR widening is not pricing the level of value. It is pricing the trajectory of value through the construction window.
Bridging loans, interestingly, remain very active in the borough. Refurbishment and change-of-use plays are the most resilient corner of the prime central market. Repositioning a tired £8m townhouse into a £14m product has predictable economics over a 9 to 14 month construction window, and that fits the bridging product profile far better than a 30-month new-build cycle. Bridging in K&C is pricing 0.65% to 0.75% per month on credible value-add stories, broadly the same as 12 months ago.
Forward funding for institutional take-out (BTR or PBSA) is restricted in K&C. The borough has very limited convertible product, and when it does work, it is on schemes specifically designed for institutional take-out from day one rather than retrofitted from open-market sale.
What is actually transacting in K&C in 2026
Three categories of activity dominate K&C deal flow in 2026, and each carries a distinct capital structure.
1. Value-add reposition (the dominant category)
Townhouse and large-flat refurbishments where the GDV uplift on completion is meaningful, the construction window is short (9 to 14 months), and the exit is to a high-net-worth end-user rather than an institutional take-out. Bridging plus a refurb-loan stack works here. This is the most active corner of the borough’s deal flow in 2026 and is the easiest place for credit committees to underwrite, because the trajectory exposure is short.
2. Development exit refinance on completing schemes
Several mid-rise resi schemes that broke ground in 2022-2023 are completing through 2026 into a softer absorption environment than originally underwritten. Development exit refinance is doing real work here, giving the original senior facility room to roll while the marketing window stretches. This is a very different deal flow from new-build origination, but it is one of the largest categories of K&C activity in current pipeline.
3. Institutional conversion of soft open-market schemes
A handful of late-2024 and 2025 completions have shifted from open-market sale to BTR or institutional rented residential balance sheets at meaningful discounts to original underwriting. The institutional yield support holds the values up where the open-market thin demand does not, and this is where the senior pool re-engages with reasonable terms.
What is much smaller in 2026: new-build resi-led origination on rare consented sites. The capital stack on a fresh K&C new-build start in 2026 requires meaningful equity (35%-plus of cost), a strong sponsor track record specifically in prime central, and a clear product differentiation argument that the lender can underwrite the trajectory through.
The counterpoint: same lender pool, opposite end of the market
This is where the K&C story sits inside the wider Greater London 2026 picture.
The same lender pool that is capping LTGDV at 65% on a Chelsea senior debt facility is happy to push to 70% on a Walthamstow town-centre scheme at half the residual value per square foot. That is not irrational. It is precisely the trajectory pricing referenced above. A £700 per square foot scheme on a rising-value path has tailwind in the underwriting model. A £1,200 per square foot scheme on a falling-value path does not, even though both schemes clear the £650 viability threshold by very different margins on price alone.
Westminster is the sister prime correction at -10.8% and behaves very similarly inside lender models. Together, K&C and Westminster represent the prime central correction zone for capital allocation purposes in 2026. The capital stack pricing referenced above applies in both boroughs with marginal variation.
What recovers the picture
Three forces could move the prime central trajectory through 2026 and into 2027.
First, a meaningful international buyer recovery, particularly from US and Middle East flows. The US dollar trajectory matters here, as does any clarification of the non-dom regime that reduces uncertainty for international long-term buyers.
Second, further Bank Rate cuts that compress the yield gap between prime central residential and gilts. The December 2025 move to 3.75% started this. Further cuts compound it directly into the equity IRR threshold.
Third, supply discipline. The 2024-2025 completion wave is now largely absorbed or repositioned. New-build origination at the prime end is well below 2018-2021 run-rate. By H2 2026 the supply side will be tighter than at any point in the last cycle, and that creates pricing power even in a thin-bid market.
None of these arrive on a defined timeline. They are the things to watch in the rate, capital flow and policy reads through the back half of 2026.
What this means for K&C site acquisition in 2026
If you are pricing a K&C site or a refurb opportunity in 2026, three things matter more than they have in any recent cycle.
One. The sub-zone matters more than the borough name. Notting Hill and South Kensington underwrite differently from Knightsbridge and Belgravia. A term sheet that does not specify the sub-zone is being mispriced.
Two. The trajectory question is the gating question. Lenders are stress-testing schemes on a -5% to -10% from current GDV scenario. A scheme that survives that stress with margin intact attracts senior debt at the better end of the prime-central band. A scheme that does not gets re-priced or declined.
Three. The construction window is now a significant variable. Short-window value-add (9 to 14 months) is the most financeable corner of the borough. Long-window new-build (24 to 36 months) carries the most trajectory exposure, and lenders are pricing that exposure into the senior margin and the equity IRR.
For full prime-central data, transaction-level references and capital stack benchmarks behind this analysis, see the Greater London Property Market Report 2026. Borough-specific intelligence sits on the Kensington and Chelsea location pages.
See also: Walthamstow +5.9% on YouTube and The £650/sq ft Cliff on YouTube.
Listen to the full episode
For the dedicated deep dive on this borough, we have published a stand-alone Kensington and Chelsea episode of the Construction Capital podcast: Kensington & Chelsea -11.2%: The Anatomy of London’s Prime Correction. Around ten minutes covering the sub-zone breakdown, the trajectory pricing the lender pool is applying, the full April 2026 prime-central capital stack, and what is actually transacting in 2026.
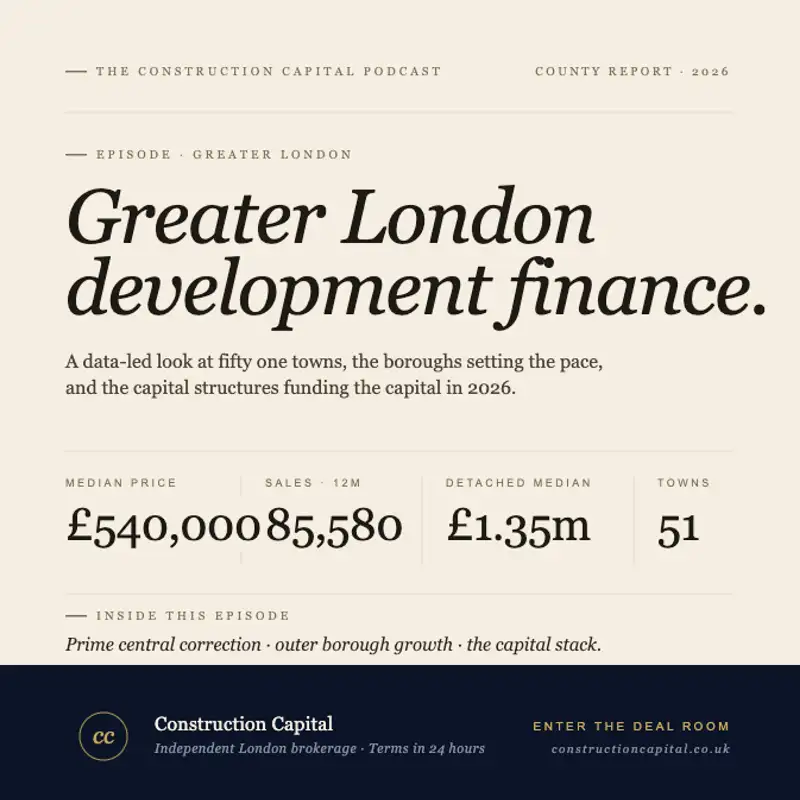
This article also draws on Episode 2 of the Construction Capital podcast: Greater London Property Development Finance 2026: Market Analysis, House Prices and Lending Outlook.
Listen anywhere
Listen on Apple Podcasts, Spotify, Overcast, Pocket Casts, or Amazon Music.
For prime-central terms within 24 hours, submit through the Construction Capital deal room. Construction Capital sources terms from over 100 lenders across development finance, bridging, mezzanine and equity.
Published by Construction Capital, an independent capital advisory brokerage sourcing terms from over 100 lenders across development finance, bridging, mezzanine, and equity. This article is part of a 20-piece Greater London 2026 series accompanying the Construction Capital podcast.